Evaluation Metrics and Implementation Methods for Automatically Measuring Output Quality of Generative AI Models

Lead
When operating generative AI in production, there are days when the field suddenly reports that "output quality has declined." However, it is not easy to pinpoint exactly when the degradation began or what scope it has affected using human evaluation alone. This article explains a method for continuously detecting such output degradation without relying on human evaluation, by combining automated evaluation metrics such as BLEU, ROUGE, and BERTScore with quality monitoring tools. The target readers are ML engineers, QA managers, and data scientists who operate generative AI in production. We introduce, along with implementation examples, everything from how to select automated evaluation metrics to the steps for introducing monitoring tools and setting alert thresholds, and demonstrate how to build an automated evaluation system that can significantly reduce the time required to detect quality degradation compared to human evaluation. We hope this will serve as a guideline when incorporating a continuous quality assurance mechanism into your own operational workflow.
If you judge the output quality of generative AI based only on a "seems good" or "seems bad" feeling, you will be unable to objectively explain changes that occur when you swap out a model or fine-tune a prompt. By using automated evaluation metrics such as BLEU, ROUGE, and BERTScore, you can measure quality numerically for each type of output—translation, summarization, question answering, and so on—and demonstrate whether improvement has occurred with concrete numbers. In what follows, we will first organize how to classify metrics and how to choose among them, and in the sections that follow, we will look concretely at the reasons for incorporating them into production operations and the implementation methods.
Why Quality Monitoring Is Necessary in Production
When the distribution of input data changes, the tendency of model output is prone to drift; conversely, even when the input distribution is stable, output quality can change due to updates to the model itself or changes in API specifications. Because generative AI models generate responses based on data as of the time of training, as production operation continues, they are affected by changes in the input distribution (changes in users' question tendencies or domain) and by version updates from the model provider.
During the PoC stage, problems can be discovered by manually checking samples, but once in production, the daily volume of output increases, making a visual check of every single item impractical. Cases have been reported in summarization tasks where, after the source document is updated, the model continues generating responses based on the old context. Because this kind of degradation progresses gradually, detection tends to be delayed if relying only on periodic sampling-based evaluation.
By automating quality monitoring, degradation in output quality can be caught within a timeframe of hours to days, reducing the risk of declining customer service quality or the provision of misinformation due to delayed response. Establishing a monitoring system for the operational phase, in line with the continuous risk management approach presented by the NIST AI RMF, forms the foundation of quality assurance.
Choosing Between Automated Metrics and Human Evaluation
Automated evaluation metrics and human evaluation are not in a substitutive relationship; rather, they share roles depending on the nature of what is being monitored. Scores such as BLEU and BERTScore can process large volumes of output on the order of seconds, making them well-suited for continuous monitoring covering all requests during production operation. On the other hand, cases have been reported where judgments such as factual accuracy, contextual appropriateness, and the presence of harmful expressions cannot be fully detected by numerical metrics alone.
Even when automated evaluation metric scores are high, a certain number of outputs will not align with human subjective evaluation. In summarization tasks, for example, a summary may be generated that diverges from the intent of the original text even though the ROUGE score is high, and such errors are difficult to catch without human evaluation. Therefore, rather than judging that quality is guaranteed simply because scores are high, it is necessary to also employ sampling-based human review in operations.
In practice, a two-stage approach is realistic: applying automated evaluation metrics as a first-pass filter to all outputs, and routing only those outputs whose scores fall below a threshold, or a randomly sampled subset, to human evaluation. QA managers should predefine the proportion and frequency of items subject to evaluation, and incorporate points of human involvement—such as those shown in What Is Human-in-the-Loop (HITL)? The Basics of "Human-Participatory" Design for Embedding AI into Business Automation—into their operational rules. The effectiveness of the monitoring system will vary greatly depending on this design.
List of Automated Evaluation Metrics for Generative AI Output Quality

Metrics for measuring the output quality of generative AI can be broadly divided into three families: surface-match metrics such as BLEU and ROUGE, which mechanically measure the overlap of words and expressions; semantic-match metrics such as BERTScore, which capture the semantic closeness of sentences in a vector space; and task-specific metrics designed for particular tasks such as summarization, translation, and question answering.
In practice, the first candidates that come up are BLEU, ROUGE, and BERTScore. Since these have broad applicability and low computational cost, they are worth treating heavily as the first evaluation axis. Task-specific metrics, on the other hand, are more accurate but less general-purpose, since they limit the target task. In the sections that follow, we will look at the calculation methods and application scenarios in line with this order of priority.
Automated Text Generation Metrics (BLEU, ROUGE, BERTScore)
BLEU, ROUGE, and BERTScore differ in role depending on whether they assess surface-level agreement or semantic agreement. Understanding this distinction helps avoid mistakes in selecting metrics appropriate to the task.
BLEU is a metric proposed by Papineni et al. in 2002 that measures the N-gram match rate between generated text and reference text. It is used as a standard in translation evaluation, and sacreBLEU, which emphasizes reproducibility, is often used for implementation. However, since it does not treat paraphrased words as matches, it tends to score lower when the wording differs even if the meaning is the same.
ROUGE is a metric for summarization evaluation published by Lin in 2004, which measures how well the generated text reproduces the N-grams contained in the reference text. There are several variants, including ROUGE-1, ROUGE-2, and ROUGE-L, and it is widely adopted for quality monitoring in summarization tasks.
BERTScore is a metric that calculates token-level semantic similarity using BERT embeddings, proposed in a paper by Zhang et al. Since it does not depend on surface-level agreement, it can handle paraphrasing and synonymous expressions, which is a clear difference from BLEU and ROUGE.
In production monitoring of Generative AI, it is practical to combine ROUGE and BLEU for summarization and translation tasks where reference texts can be prepared, with BERTScore for evaluating dialogue generation or RAG (Retrieval-Augmented Generation) responses where more semantic validity needs to be confirmed. Rather than relying on a single metric, logging multiple metrics and tracking trends leads to early detection of quality degradation.
Metrics for Measuring Semantic Alignment (Semantic Similarity, Cosine Similarity)
When you want to detect paraphrasing, semantic agreement based on cosine similarity is effective, while surface-level agreement metrics like BLEU and ROUGE are suited for evaluating the word order itself. In measuring semantic agreement, the output sentence and the reference sentence are vectorized using embeddings, and cosine similarity is used to quantify how close the two directions are. This is not a scoring method that requires "exact word matches," but rather an evaluation method that measures "whether the semantic direction is the same even if the phrasing differs."
BERTScore also belongs to this lineage, as it aggregates token-level embedding similarity into a score, giving it the characteristic of tending to return reasonable evaluations even when there is paraphrasing or word order changes. On the other hand, semantic agreement also has limitations. For technical terms or domain-specific expressions not included in the embedding model's training data, there are reported cases where the score does not correspond to the actual semantic difference.
In implementation, using a multilingual embedding model such as Gemini Embedding 2 allows semantic agreement of outputs, including translation tasks and multilingual NLP, to be measured on a consistent basis. For threshold design, rather than relying on a single metric, an operation that combines it with surface-level agreement metrics for evaluation is a choice that is easier to balance in practice.
Task-Specific Evaluation Metrics (Summarization, Translation, Question Answering)
Since summarization, translation, and question answering differ in the nature of quality required, there are cases where general-purpose BLEU, ROUGE, and BERTScore alone lack sufficient granularity for evaluation. Combining metrics suited to the characteristics of the task is a condition for improving accuracy.
In summarization tasks, the central point of evaluation is how much of the source text's key points can be compressed without omission. Since ROUGE measures the N-gram overlap rate, it is widely used as the standard for summarization evaluation, but it has the weakness of not easily capturing semantic agreement achieved through paraphrasing. In fact, a summary that retains the key points but completely replaces the wording tends to score low on ROUGE, and to compensate for this weakness, it is effective in practice to use BERTScore together to confirm whether the meaning is preserved even when the vocabulary differs.
In translation tasks, COMET and BLEURT, developed for the purpose of evaluating machine translation quality, are valued for their high correlation with reference values. COMET, as a neural network-based evaluation framework, is reported to have a higher correlation with human judgment than BLEU, making it suitable for continuous monitoring of translation quality. METEOR can also account for synonyms and word inflections, and is sometimes used as a complementary metric to BLEU.
In question answering tasks, the central point of evaluation is accuracy—whether the answer precisely addresses the intent of the question. Since simple string matching would falsely flag paraphrased correct answers as errors, it is necessary to combine it with metrics that measure semantic agreement. The selection of metrics depends on the purpose of the task, and is a condition that directly affects monitoring accuracy itself.
Implementation Methods for Automatically Measuring Generative AI Output Quality

The implementation of evaluation metrics is built by combining three elements: calculation logic, storage destination, and visualization method. Centering on the logging mechanism and the selection of monitoring tools, the implementation flow is explained step by step below.
Mechanisms for Calculating Metrics and Logging
The evaluation pipeline is constructed with a structure similar to a factory inspection line. It is a flow in which the outputs of Generative AI are passed through one by one like an assembly line, multiple metrics are measured, and only after the results are recorded is it shipped out (reflected in production).
Specifically, inference results and reference texts (correct-answer data or reference summaries) are saved as pairs, and BLEU, ROUGE, BERTScore, and other metrics are calculated via batch processing. The reason for choosing batch processing is that real-time calculation would add evaluation cost on top of inference latency, delaying production responses. In many field settings, a configuration is adopted in which inference logs are first accumulated in a queue or storage, and evaluation jobs are run asynchronously every few minutes to a few hours.
Logs should at minimum include the input prompt, output text, reference data, scores for each metric, model version, and timestamp. Without recording the model version, it becomes impossible to later distinguish whether the cause of quality degradation was a model update or a change in data. Since BERTScore depends on an embedding model, the version of the evaluation model should also be fixed and recorded.
These logs are fed into a time-series database or a metrics collection platform (such as Prometheus), and are used for visualization and anomaly detection on the monitoring tool side, as described next.
Selecting and Deploying Monitoring Tools and Platforms
If the monitoring target is drift detection for text generation quality, OSS tools such as Evidently or NannyML are suitable, while Prometheus-based custom implementation is preferable when you want to integrate metrics into an existing time-series infrastructure. Evidently is an open-source monitoring framework for ML/LLM that allows relatively quick setup for tracking data drift and changes in output distribution, following its official documentation. NannyML has strengths in performance estimation without labels, making it suitable for use cases in production environments where ground-truth data acquisition is delayed, allowing early detection of signs of quality degradation.
For organizations primarily operating in the cloud, Amazon SageMaker Model Monitor is also an option, but note that the official documentation states that access for new customers will end on July 30, 2026, so when considering new adoption, you should check the latest information in the official documentation before making a decision.
The key axes for selection are the integration cost with existing MLOps infrastructure and connectivity with the pipeline that calculates the required metrics (BLEU, ROUGE, BERTScore, etc.). For organizations already collecting system metrics with Prometheus, a configuration that exports evaluation metrics and monitors thresholds via PromQL is well suited for unifying operations. Conversely, if you want to handle everything from metric calculation to drift detection in one package, prioritizing ML-specialized tools such as Evidently or NannyML can reduce implementation burden.
Setting Alerts and Thresholds to Detect Quality Degradation

Since evaluation metric values fluctuate daily, simple threshold monitoring is prone to false positives. By using statistical anomaly detection to distinguish noise from substantive degradation, and by establishing a rationale for threshold settings along with operational rules, you can achieve both alert accuracy and responsiveness.
Methods for Detecting Quality Decline (Statistical Anomaly Detection)
When BLEU or BERTScore scores keep declining slightly week over week, how should you determine whether it's temporary noise or substantive model degradation? In practice, teams often struggle with this judgment call, leaving the decision of whether to raise an alert or wait and observe unresolved.
Statistical anomaly detection is a method that entrusts this judgment to numerical criteria rather than human intuition. The three representative methods are:
- Control charts using moving averages and standard deviation (values deviating by more than a certain multiple of the standard deviation from the average of the past N days are considered anomalous)
- Drift tests that detect changes in distribution (testing whether the distribution of input data or output scores is statistically different from a past baseline distribution)
- Residual monitoring using time-series forecasting models (alerting when the difference between predicted and actual values exceeds a threshold)
Evidently and NannyML have such drift detection as standard features, and an implementation advantage is that they can visualize changes in the distribution of input prompts separately from degradation in output scores. For example, if the topic on the input side suddenly changes, it is more likely to reflect a change in usage patterns rather than degradation of the model itself, and the priority for response would be lower. On the other hand, if BERTScore continues to decline even though the input distribution remains stable, this provides grounds for suspecting degradation of the model or prompt template. In this way, a practical point for reducing false alarms is to interpret detection results not in isolation, but by combining changes on both the input side and the output side.
Setting Alert Thresholds and Operational Rules
Decision criterion: Thresholds should not be fixed values, but should be set based on deviation from a baseline obtained through statistical anomaly detection.
If the change-point detection and outlier scores discussed in the previous section are used directly for notifications, false alarms increase. A practical approach is a two-tier structure: issue a warning when the average value of BERTScore or ROUGE drops by more than a certain multiple of the standard deviation from the past moving average, and issue an urgent notification when it drops even further beyond that. If only a single threshold tier is set, even minor fluctuations trigger urgent responses, leading to alert fatigue.
Operational rules should be documented from the following perspectives:
- Notification routing: Warning-level alerts go to the development team's chat, while urgent-level alerts are sent directly to the QA lead
- Verification procedure: When an alert occurs, manually check sample outputs to determine whether the metric decline reflects actual quality degradation or a false positive caused by bias in the evaluation dataset
- Threshold retraining: When a model update or prompt change is made, recalculate the baseline and update the thresholds. Forgetting to update can cause improved outputs to be mistakenly flagged as degradation
Defining this two-tier alerting as rules in Prometheus's PromQL means that changes to notification destinations or thresholds can be completed simply by editing the configuration file, reducing the burden on operations staff. Thresholds should not be set once and left alone—reviewing them periodically better matches actual practice.
Comparison Table of Generative AI Output Quality Monitoring Tools

The choice depends on whether you already have an existing MLOps infrastructure. If you want to lightly introduce only statistical drift detection, OSS is suitable; if you need traceability of LLM output and collaboration across teams, an integrated platform is suitable; and if you want to stay entirely within an AWS environment, a cloud-embedded solution is suitable.
| Comparison target | Evaluation axis | Decision point |
|---|---|---|
| Evidently | Drift detection, OSS flexibility | High freedom in code implementation, low cost to integrate into existing pipelines |
| NannyML | Performance estimation, handling label delay | Strength in estimating degradation even in operations where ground-truth labels arrive late |
| Weights & Biases | Experiment tracking, visualization | Easy to centralize experiment management and evaluation logs for fine-tuning using LoRA or PEFT |
| Arize | LLM observability, root-cause analysis | Well-structured path from detecting anomalies in production traffic to identifying root causes |
| Amazon SageMaker Model Monitor | Cloud integration, unified operations | Suitable for operations within an AWS environment, but note that access for new customers is ending, so check official documentation before adoption |
| Prometheus | Metrics collection, alerting infrastructure | Effective when you want to manage evaluation metrics as time series via PromQL and integrate with existing monitoring infrastructure |
When selecting, confirm in advance whether the frequency of metric calculation, retention period, and alert notification destinations align with your existing operational workflow. Since license terms and pricing may change, it is recommended to check the latest official documentation.
Frequently Asked Questions About Generative AI Output Quality Evaluation

This section compiles frequently asked questions about operating automated evaluation metrics, organized around three perspectives: metric selection, alert design, and root cause analysis. Use it as reference material for implementation decisions.
Are Automated Metrics Alone Sufficient, or Is Human Evaluation Necessary?
If we keep running only automated evaluation metrics, can quality really be protected?
The answer depends on the conditions. BLEU, ROUGE, and BERTScore quantify the degree of match in strings or meaning, but they cannot judge factual accuracy, contextual appropriateness, or the presence of harmful content. Cases have been reported in summarization and question-answering tasks where outputs that are superficially similar to the reference text but factually incorrect are mistakenly scored highly.
For this reason, a two-tier approach is standard in practice. Day-to-day monitoring is covered by automated evaluation metrics, and only outputs whose scores fall below a threshold, or outputs that receive a concentration of user complaints, are routed to human evaluation. Automating this extraction process itself can significantly narrow down the items requiring review compared to reviewing every single case by hand.
On the other hand, in domains where the impact of errors is severe—such as healthcare, finance, and legal—it is recommended to periodically review a certain proportion of outputs by hand regardless of the automated evaluation results. When consistency with reference documents is a concern in RAG (Retrieval-Augmented Generation) architectures, it is also worth considering a review of retrieval accuracy, as introduced in What is Adaptive RAG? How Query-Driven Dynamic Retrieval Balances Cost and Accuracy. It is important to understand that automated evaluation metrics are the entry point for monitoring, not a complete substitute for final judgment.
Which Evaluation Metrics Should Be Prioritized for Monitoring?
Decision criteria: The metrics that should be prioritized differ depending on the type of task and the degree of freedom in the output.
For tasks such as summarization and translation, where a reference text close to the correct answer exists, ROUGE and BLEU—metrics based on lexical matching—should be the first choice for monitoring. Because they are computationally inexpensive and can be logged at near real-time frequency on a per-response basis, they are well-suited for production environments handling large volumes of traffic.
On the other hand, for tasks with a high degree of expressive freedom, such as chatbots and text generation, lexical matching alone unfairly penalizes paraphrasing. In this case, it is more appropriate to use a semantic similarity metric such as BERTScore as the primary metric, treating ROUGE as a supplementary reference value.
For question-answering systems, factual consistency is the most critical concern, so it is effective to combine semantic similarity metrics with grounding checks and individually verify consistency with source documents.
The following serves as a guideline for determining priority:
- Summarization/translation with reference text: Start with ROUGE/BLEU, adding BERTScore as needed
- Highly flexible dialogue generation: Use BERTScore as the primary metric, treating lexical matching metrics as supplementary
- Question-answering requiring factuality: Combine semantic similarity with grounding checks
In all cases, judging quality based on a single metric alone tends to result in false positives or missed issues, so a design that combines multiple metrics for multi-faceted monitoring reduces practical risk.
What Causes Quality Degradation, and How Should It Be Addressed?
When trends in input data change, data drift is likely the cause; when the model itself or a dependent API is updated, model drift is likely the cause—distinguishing between these is the first step in addressing the issue. Data drift is a phenomenon similar to "the taste changing even when using the same recipe, if the origin of the ingredients changes"; as user question trends or the content of reference documents gradually shift, deviations from the baseline values of BLEU or BERTScore occur.
Model drift, on the other hand, refers to cases where the output tendency itself changes due to updates to an external API's model or retraining of a fine-tuned model. In this case, the pattern of score decline is often abrupt, and cross-referencing recent deployment history or API version change logs makes it easier to identify the cause.
The priority for addressing this is first to check reproducibility. If re-running the same input still yields a low score, suspect changes on the model or prompt template side; if changing the input stabilizes the results, suspect changes on the data side. In a RAG architecture, the search results from the vector database may also be degraded, so it is effective to individually verify retrieval accuracy using a grounding check. Once the cause has been identified, starting with a fix that limits the scope of impact—such as rolling back the prompt or rebuilding the search index—can shorten the time to recovery.
Steps to Begin Automated Measurement of Generative AI Output Quality

Building an automated measurement system involves fewer failures when progressed step by step, from metric selection to alert operation. First, identify the current task types (summarization, translation, question answering, etc.) and select one or two metrics suited to the task from among BLEU, ROUGE, and BERTScore. Next, incorporate the evaluation script into the inference pipeline and set up a mechanism to automatically save output logs and scores.
Then, introduce a monitoring tool such as Evidently or NannyML to visualize the time-series changes in scores. At this stage, tentatively set a threshold for detecting quality degradation, observe trends over several weeks of actual operational data, and then finalize the production alert threshold—this helps suppress initial false positives.
Finally, document the response flow for when an alert is triggered (retraining, prompt correction, switching to human review, etc.) as an operational rule. If you are considering the design of HITL, What is Human-in-the-Loop (HITL)? The Fundamentals of "Human-Participatory" Design for Establishing AI-Driven Business Automation may also serve as a useful reference.
By progressing through this series of steps in five stages—metric selection, pipeline integration, monitoring tool introduction, threshold adjustment, and operational rule documentation—it is possible to build a continuous quality monitoring system that does not rely on human evaluation.
Author & Supervisor

Yusuke Ishihara
Started programming at age 13 with MSX. After graduating from Musashi University, worked on large-scale system development including airline core systems and Japan's first Windows server hosting/VPS infrastructure. Co-founded Site Engine Inc. in 2008. Founded Unimon Inc. in 2010 and Enison Inc. in 2025, leading development of business systems, NLP, and platform solutions. Currently focuses on product development and AI/DX initiatives leveraging generative AI and large language models (LLMs).
Recommended Articles


Terms related to this article

AI Observability
An operational practice of continuously monitoring and visualizing the inputs/outputs, latency, cost
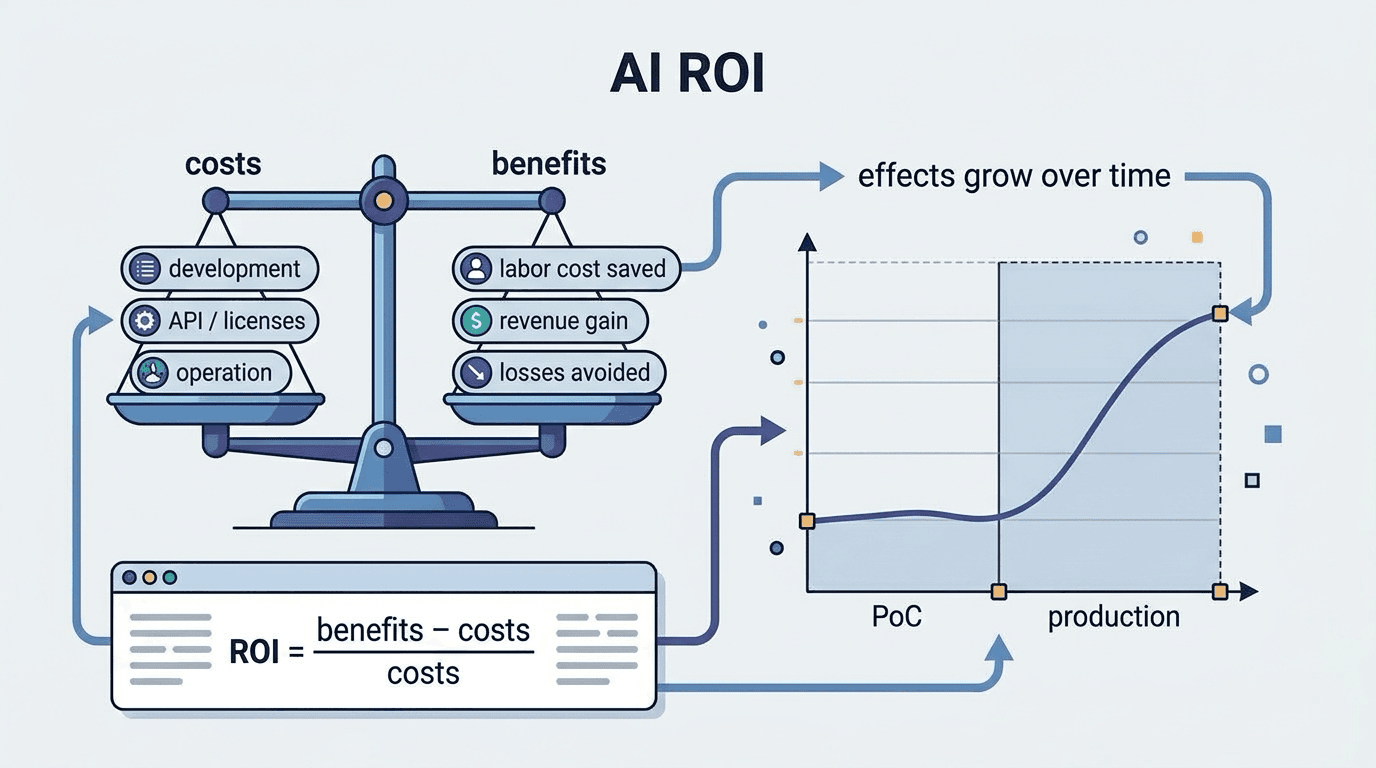
AI ROI (Return on Investment in AI)
AI ROI is a metric that quantitatively measures the effects obtained — such as operational efficienc
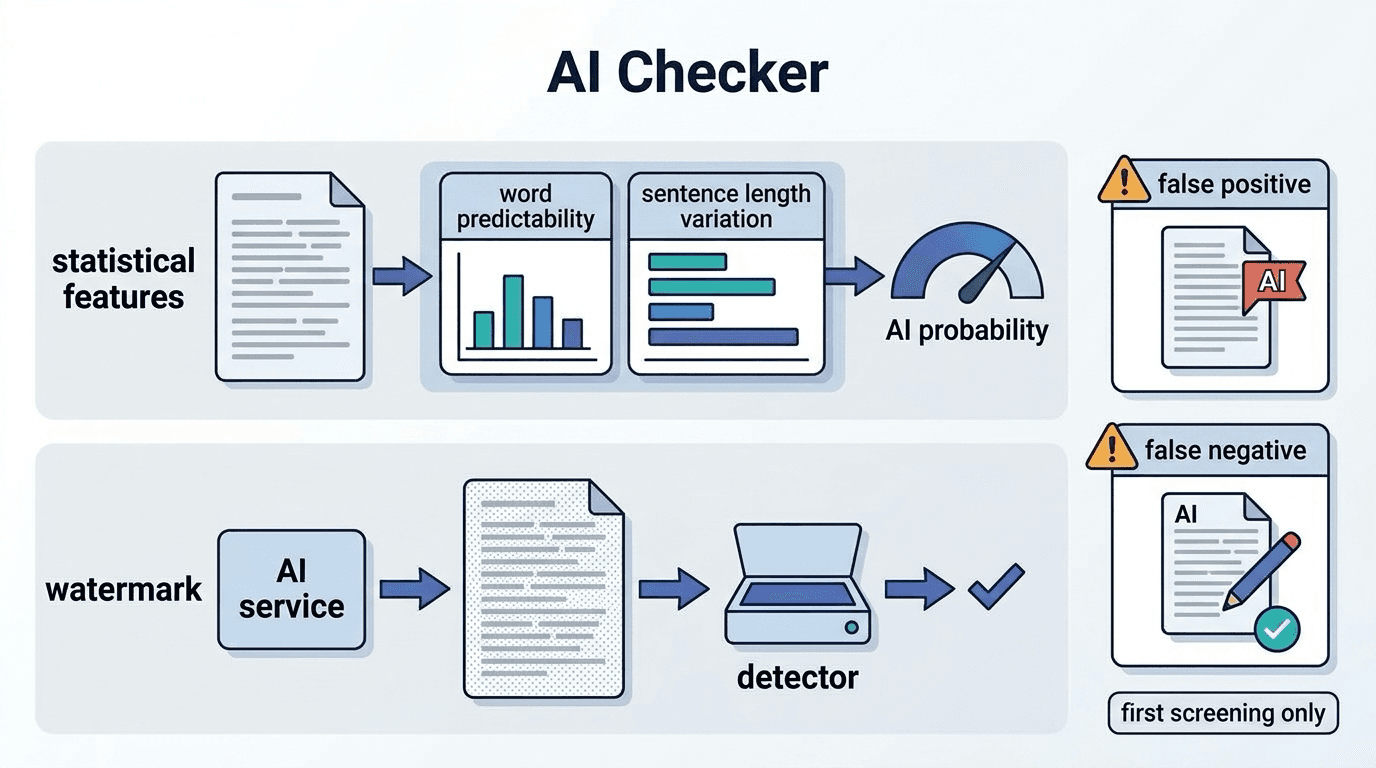
AI Checker (AI-generated text detector)
An AI checker is a tool that estimates whether a piece of writing was generated by AI, mainly from s